MII/mai/lec1.ipynb

173 KiB
Raw Blame History

Работа с NumPy

In [1]:
import numpy as np

matrix = np.array([[4, 5, 0], [9, 9, 9]])
print("matrix = \n", matrix, "\n")

tmatrix = matrix.T
print("tmatrix = \n", tmatrix, "\n")

vector = np.ravel(matrix)
print("vector = \n", vector, "\n")

tvector = np.reshape(vector, (6, 1))
print("tvector = \n", tvector, "\n")

list_matrix = list(matrix)
print("list_matrix = \n", list_matrix, "\n")

str_matrix = str(matrix)
print("matrix as str = \n", str_matrix, "\n")

print("matrix type is", type(matrix), "\n")

print("vector type is", type(vector), "\n")

print("list_matrix type is", type(list_matrix), "\n")

print("str_matrix type is", type(str_matrix), "\n")

formatted_vector = "; ".join(map(str, vector))
print("formatted_vector = \n", formatted_vector, "\n")
matrix = 
 [[4 5 0]
 [9 9 9]] 

tmatrix = 
 [[4 9]
 [5 9]
 [0 9]] 

vector = 
 [4 5 0 9 9 9] 

tvector = 
 [[4]
 [5]
 [0]
 [9]
 [9]
 [9]] 

list_matrix = 
 [array([4, 5, 0]), array([9, 9, 9])] 

matrix as str = 
 [[4 5 0]
 [9 9 9]] 

matrix type is <class 'numpy.ndarray'> 

vector type is <class 'numpy.ndarray'> 

list_matrix type is <class 'list'> 

str_matrix type is <class 'str'> 

formatted_vector = 
 4; 5; 0; 9; 9; 9 

Работа с Pandas DataFrame

https://pandas.pydata.org/docs/user_guide/10min.html

Работа с данными - чтение и запись CSV

In [2]:
import pandas as pd

df = pd.read_csv("data/titanic.csv", index_col="PassengerId")

df.to_csv("test.csv")

Работа с данными - основные команды

In [3]:
df.info()

print(df.describe().transpose())

cleared_df = df.drop(["Name", "Ticket", "Embarked"], axis=1)
print(cleared_df.head())
print(cleared_df.tail())

sorted_df = cleared_df.sort_values(by="Age")
print(sorted_df.head())
print(sorted_df.tail())
<class 'pandas.core.frame.DataFrame'>
Index: 891 entries, 1 to 891
Data columns (total 11 columns):
 #   Column    Non-Null Count  Dtype  
---  ------    --------------  -----  
 0   Survived  891 non-null    int64  
 1   Pclass    891 non-null    int64  
 2   Name      891 non-null    object 
 3   Sex       891 non-null    object 
 4   Age       714 non-null    float64
 5   SibSp     891 non-null    int64  
 6   Parch     891 non-null    int64  
 7   Ticket    891 non-null    object 
 8   Fare      891 non-null    float64
 9   Cabin     204 non-null    object 
 10  Embarked  889 non-null    object 
dtypes: float64(2), int64(4), object(5)
memory usage: 83.5+ KB
          count       mean        std   min      25%      50%   75%       max
Survived  891.0   0.383838   0.486592  0.00   0.0000   0.0000   1.0    1.0000
Pclass    891.0   2.308642   0.836071  1.00   2.0000   3.0000   3.0    3.0000
Age       714.0  29.699118  14.526497  0.42  20.1250  28.0000  38.0   80.0000
SibSp     891.0   0.523008   1.102743  0.00   0.0000   0.0000   1.0    8.0000
Parch     891.0   0.381594   0.806057  0.00   0.0000   0.0000   0.0    6.0000
Fare      891.0  32.204208  49.693429  0.00   7.9104  14.4542  31.0  512.3292
             Survived  Pclass     Sex   Age  SibSp  Parch     Fare Cabin
PassengerId                                                             
1                   0       3    male  22.0      1      0   7.2500   NaN
2                   1       1  female  38.0      1      0  71.2833   C85
3                   1       3  female  26.0      0      0   7.9250   NaN
4                   1       1  female  35.0      1      0  53.1000  C123
5                   0       3    male  35.0      0      0   8.0500   NaN
             Survived  Pclass     Sex   Age  SibSp  Parch   Fare Cabin
PassengerId                                                           
887                 0       2    male  27.0      0      0  13.00   NaN
888                 1       1  female  19.0      0      0  30.00   B42
889                 0       3  female   NaN      1      2  23.45   NaN
890                 1       1    male  26.0      0      0  30.00  C148
891                 0       3    male  32.0      0      0   7.75   NaN
             Survived  Pclass     Sex   Age  SibSp  Parch     Fare Cabin
PassengerId                                                             
804                 1       3    male  0.42      0      1   8.5167   NaN
756                 1       2    male  0.67      1      1  14.5000   NaN
470                 1       3  female  0.75      2      1  19.2583   NaN
645                 1       3  female  0.75      2      1  19.2583   NaN
79                  1       2    male  0.83      0      2  29.0000   NaN
             Survived  Pclass     Sex  Age  SibSp  Parch     Fare Cabin
PassengerId                                                            
860                 0       3    male  NaN      0      0   7.2292   NaN
864                 0       3  female  NaN      8      2  69.5500   NaN
869                 0       3    male  NaN      0      0   9.5000   NaN
879                 0       3    male  NaN      0      0   7.8958   NaN
889                 0       3  female  NaN      1      2  23.4500   NaN

Работа с данными - работа с элементами

In [4]:
print(df["Age"])

print(df.loc[100])

print(df.loc[100, "Name"])

print(df.loc[100:200, ["Age", "Name"]])

print(df[0:3])

print(df.iloc[0])

print(df.iloc[3:5, 0:2])

print(df.iloc[[3, 4], [0, 1]])
PassengerId
1      22.0
2      38.0
3      26.0
4      35.0
5      35.0
       ... 
887    27.0
888    19.0
889     NaN
890    26.0
891    32.0
Name: Age, Length: 891, dtype: float64
Survived                    0
Pclass                      2
Name        Kantor, Mr. Sinai
Sex                      male
Age                      34.0
SibSp                       1
Parch                       0
Ticket                 244367
Fare                     26.0
Cabin                     NaN
Embarked                    S
Name: 100, dtype: object
Kantor, Mr. Sinai
              Age                                    Name
PassengerId                                              
100          34.0                       Kantor, Mr. Sinai
101          28.0                 Petranec, Miss. Matilda
102           NaN        Petroff, Mr. Pastcho ("Pentcho")
103          21.0               White, Mr. Richard Frasar
104          33.0              Johansson, Mr. Gustaf Joel
...           ...                                     ...
196          58.0                    Lurette, Miss. Elise
197           NaN                     Mernagh, Mr. Robert
198          42.0        Olsen, Mr. Karl Siegwart Andreas
199           NaN        Madigan, Miss. Margaret "Maggie"
200          24.0  Yrois, Miss. Henriette ("Mrs Harbeck")

[101 rows x 2 columns]
             Survived  Pclass  \
PassengerId                     
1                   0       3   
2                   1       1   
3                   1       3   

                                                          Name     Sex   Age  \
PassengerId                                                                    
1                                      Braund, Mr. Owen Harris    male  22.0   
2            Cumings, Mrs. John Bradley (Florence Briggs Th...  female  38.0   
3                                       Heikkinen, Miss. Laina  female  26.0   

             SibSp  Parch            Ticket     Fare Cabin Embarked  
PassengerId                                                          
1                1      0         A/5 21171   7.2500   NaN        S  
2                1      0          PC 17599  71.2833   C85        C  
3                0      0  STON/O2. 3101282   7.9250   NaN        S  
Survived                          0
Pclass                            3
Name        Braund, Mr. Owen Harris
Sex                            male
Age                            22.0
SibSp                             1
Parch                             0
Ticket                    A/5 21171
Fare                           7.25
Cabin                           NaN
Embarked                          S
Name: 1, dtype: object
             Survived  Pclass
PassengerId                  
4                   1       1
5                   0       3
             Survived  Pclass
PassengerId                  
4                   1       1
5                   0       3

Работа с данными - отбор и группировка

In [12]:
s_values = df["Sex"].unique()
print(s_values)

s_total = 0
for s_value in s_values:
    count = df[df["Sex"] == s_value].shape[0]
    s_total += count
    print(s_value, "count =", count)
print("Total count = ", s_total)

print(df.groupby(["Pclass", "Survived"]).size().reset_index(name="Count")) # type: ignore
['male' 'female']
male count = 577
female count = 314
Total count =  891
   Pclass  Survived  Count
0       1         0     80
1       1         1    136
2       2         0     97
3       2         1     87
4       3         0    372
5       3         1    119

Визуализация - Исходные данные

In [6]:
data = df[["Pclass", "Survived", "Age"]].copy()
data.dropna(subset=["Age"], inplace=True)
print(data)
             Pclass  Survived   Age
PassengerId                        
1                 3         0  22.0
2                 1         1  38.0
3                 3         1  26.0
4                 1         1  35.0
5                 3         0  35.0
...             ...       ...   ...
886               3         0  39.0
887               2         0  27.0
888               1         1  19.0
890               1         1  26.0
891               3         0  32.0

[714 rows x 3 columns]

Визуализация - Сводка пяти чисел
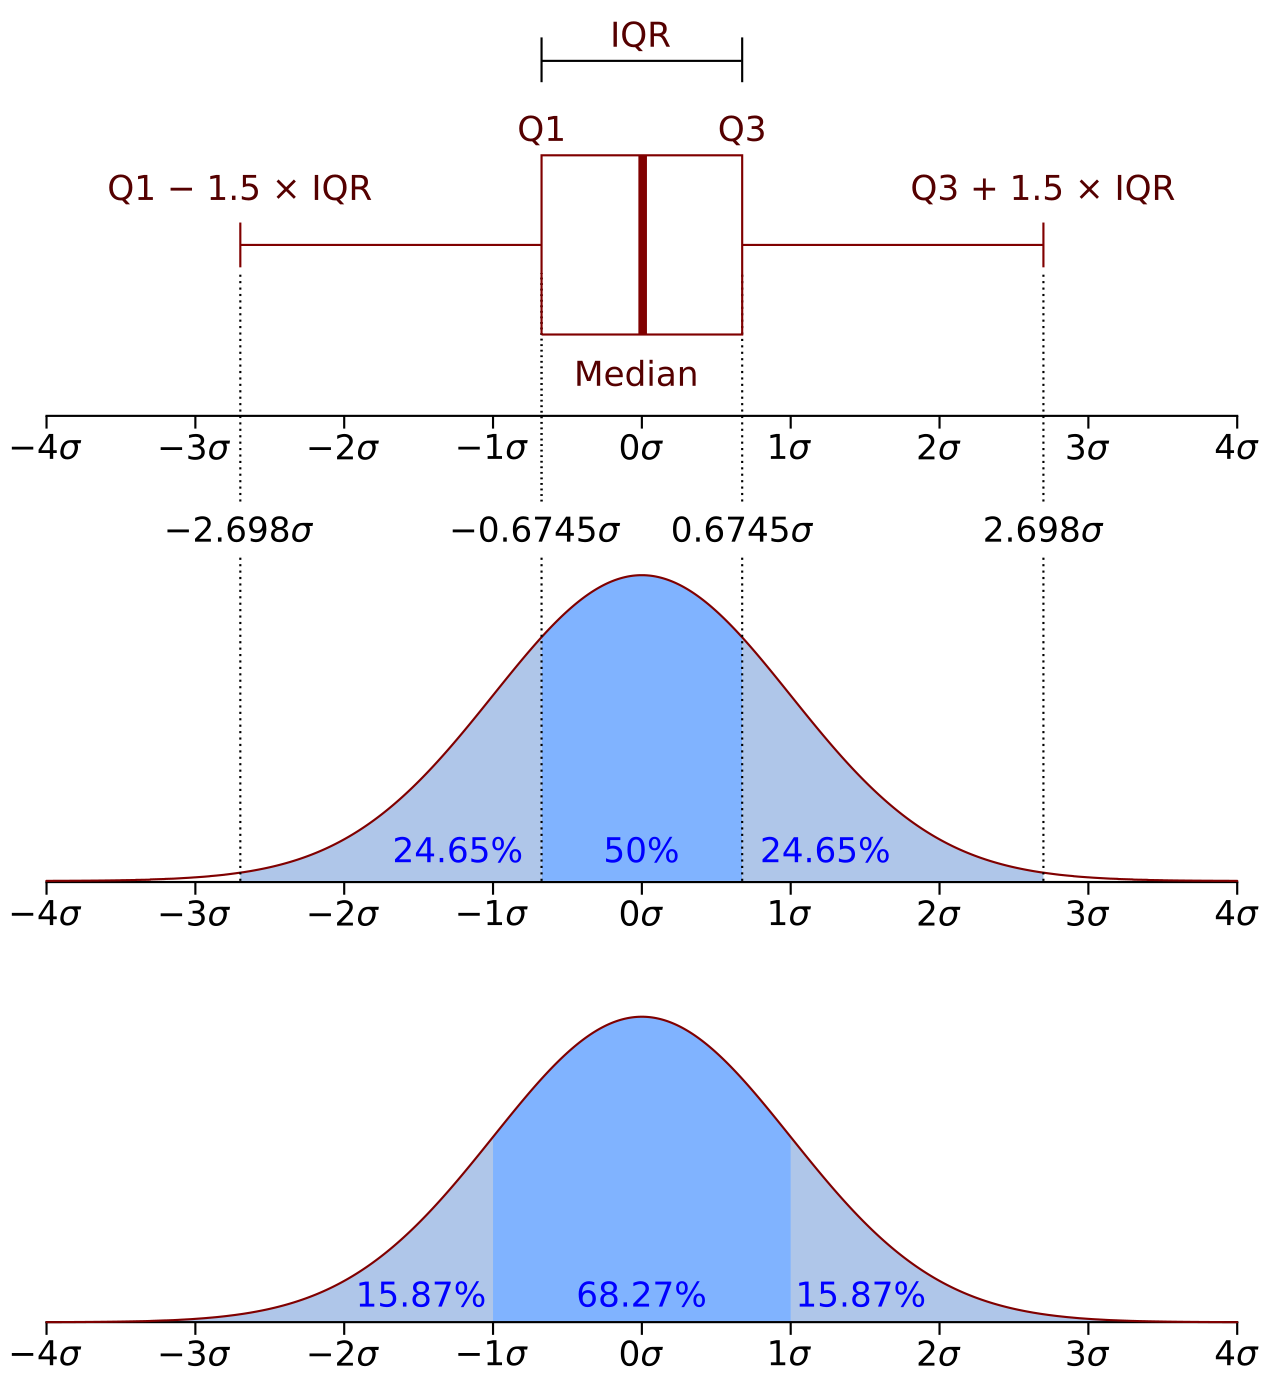
No description has been provided for this image
In [7]:
def q1(x):
    return x.quantile(0.25)


# median = quantile(0.5)
def q2(x):
    return x.quantile(0.5)


def q3(x):
    return x.quantile(0.75)


def iqr(x):
    return q3(x) - q1(x)


def low_iqr(x):
    return max(0, q1(x) - 1.5 * iqr(x))


def high_iqr(x):
    return q3(x) + 1.5 * iqr(x)


quantiles = data[["Pclass", "Age"]].groupby(["Pclass"]).aggregate(["min", q1, q2, "median", q3, "max"])
print(quantiles)

iqrs = data[["Pclass", "Age"]].groupby(["Pclass"]).aggregate([low_iqr, iqr, high_iqr])
print(iqrs)

data.boxplot(column="Age", by="Pclass")
         Age                               
         min    q1    q2 median    q3   max
Pclass                                     
1       0.92  27.0  37.0   37.0  49.0  80.0
2       0.67  23.0  29.0   29.0  36.0  70.0
3       0.42  18.0  24.0   24.0  32.0  74.0
           Age               
       low_iqr   iqr high_iqr
Pclass                       
1          0.0  22.0     82.0
2          3.5  13.0     55.5
3          0.0  14.0     53.0
Out[7]:
<Axes: title={'center': 'Age'}, xlabel='Pclass'>
No description has been provided for this image

Визуализация - Гистограмма

In [8]:
data.plot.hist(column=["Age"], bins=80)
Out[8]:
<Axes: ylabel='Frequency'>
No description has been provided for this image

Визуализация - Точечная диаграмма

In [9]:
df.plot.scatter(x="Age", y="Sex")

df.plot.scatter(x="Pclass", y="Age")
Out[9]:
<Axes: xlabel='Pclass', ylabel='Age'>
No description has been provided for this image

Визуализация - Столбчатая диаграмма

In [10]:
plot = data.groupby(["Pclass", "Survived"]).size().unstack().plot.bar(color=["pink", "green"])
plot.legend(["Not survived", "Survived"])
Out[10]:
<matplotlib.legend.Legend at 0x1ac1cd1c6e0>
No description has been provided for this image

Визуализация - Временные ряды

In [11]:
from datetime import datetime
import matplotlib.dates as md

ts = pd.read_csv("data/dollar.csv")
ts["date"] = ts.apply(lambda row: datetime.strptime(row["my_date"], "%d.%m.%Y"), axis=1)
ts.info()

print(ts)

plot = ts.plot.line(x="date", y="my_value")
plot.xaxis.set_major_locator(md.DayLocator(interval=10))
plot.xaxis.set_major_formatter(md.DateFormatter("%d.%m.%Y"))
plot.tick_params(axis="x", labelrotation=90)
<class 'pandas.core.frame.DataFrame'>
RangeIndex: 243 entries, 0 to 242
Data columns (total 6 columns):
 #   Column       Non-Null Count  Dtype         
---  ------       --------------  -----         
 0   my_date      243 non-null    object        
 1   my_value     243 non-null    float64       
 2   bullet       2 non-null      object        
 3   bulletClass  2 non-null      object        
 4   label        2 non-null      object        
 5   date         243 non-null    datetime64[ns]
dtypes: datetime64[ns](1), float64(1), object(4)
memory usage: 11.5+ KB
        my_date  my_value bullet bulletClass label       date
0    28.03.2023   76.5662    NaN         NaN   NaN 2023-03-28
1    31.03.2023   77.0863    NaN         NaN   NaN 2023-03-31
2    01.04.2023   77.3233    NaN         NaN   NaN 2023-04-01
3    04.04.2023   77.9510    NaN         NaN   NaN 2023-04-04
4    05.04.2023   79.3563    NaN         NaN   NaN 2023-04-05
..          ...       ...    ...         ...   ...        ...
238  20.03.2024   92.2243    NaN         NaN   NaN 2024-03-20
239  21.03.2024   92.6861    NaN         NaN   NaN 2024-03-21
240  22.03.2024   91.9499    NaN         NaN   NaN 2024-03-22
241  23.03.2024   92.6118    NaN         NaN   NaN 2024-03-23
242  26.03.2024   92.7761    NaN         NaN   NaN 2024-03-26

[243 rows x 6 columns]
No description has been provided for this image