34 KiB
34 KiB
Загрузка данных в DataFrame
In [1]:
import pandas as pd

df = pd.read_csv("data/titanic.csv", index_col="PassengerId")

df.info()

print(df.shape)

df.head()
Out[1]:
Получение сведений о пропущенных данных
Типы пропущенных данных:
- None - представление пустых данных в Python
- NaN - представление пустых данных в Pandas
- '' - пустая строка
In [2]:
# Количество пустых значений признаков
print(df.isnull().sum())

print()

# Есть ли пустые значения признаков
print(df.isnull().any())

print()

# Процент пустых значений признаков
for i in df.columns:
    null_rate = df[i].isnull().sum() / len(df) * 100
    if null_rate > 0:
        print(f"{i} процент пустых значений: %{null_rate:.2f}")
In [3]:
fillna_df = df.fillna(0)

print(fillna_df.shape)

print(fillna_df.isnull().any())

# Замена пустых данных на 0
df["AgeFillNA"] = df["Age"].fillna(0)

# Замена пустых данных на медиану
df["AgeFillMedian"] = df["Age"].fillna(df["Age"].median())

df.tail()
Out[3]:
In [4]:
df["AgeCopy"] = df["Age"]

# Замена данных сразу в DataFrame без копирования
df.fillna({"AgeCopy": 0}, inplace=True)

df.tail()
Out[4]:
Удаление наблюдений с пропусками
In [5]:
dropna_df = df.dropna()

print(dropna_df.shape)

print(fillna_df.isnull().any())
In [6]:
# Функция для создания выборок
from sklearn.model_selection import train_test_split
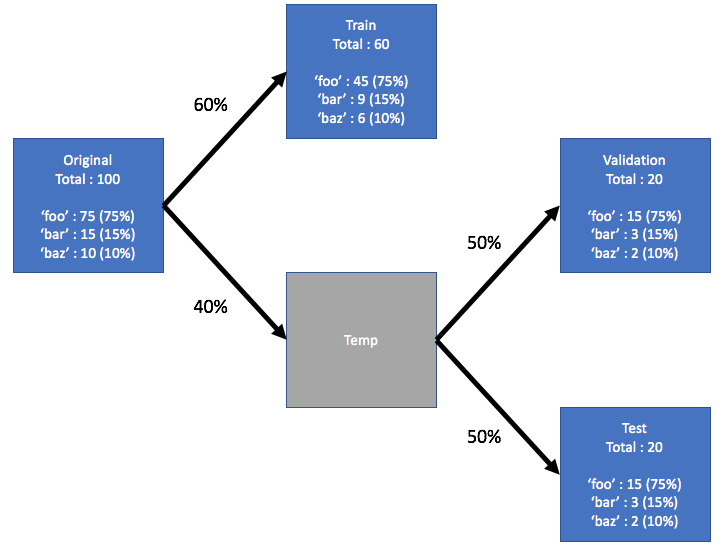
def split_stratified_into_train_val_test(
df_input,
stratify_colname="y",
frac_train=0.6,
frac_val=0.15,
frac_test=0.25,
random_state=None,
):
"""
Splits a Pandas dataframe into three subsets (train, val, and test)
following fractional ratios provided by the user, where each subset is
stratified by the values in a specific column (that is, each subset has
the same relative frequency of the values in the column). It performs this
splitting by running train_test_split() twice.
Parameters
----------
df_input : Pandas dataframe
Input dataframe to be split.
stratify_colname : str
The name of the column that will be used for stratification. Usually
this column would be for the label.
frac_train : float
frac_val : float
frac_test : float
The ratios with which the dataframe will be split into train, val, and
test data. The values should be expressed as float fractions and should
sum to 1.0.
random_state : int, None, or RandomStateInstance
Value to be passed to train_test_split().
Returns
-------
df_train, df_val, df_test :
Dataframes containing the three splits.
"""
if frac_train + frac_val + frac_test != 1.0:
raise ValueError(
"fractions %f, %f, %f do not add up to 1.0"
% (frac_train, frac_val, frac_test)
)
if stratify_colname not in df_input.columns:
raise ValueError("%s is not a column in the dataframe" % (stratify_colname))
X = df_input # Contains all columns.
y = df_input[
[stratify_colname]
] # Dataframe of just the column on which to stratify.
# Split original dataframe into train and temp dataframes.
df_train, df_temp, y_train, y_temp = train_test_split(
X, y, stratify=y, test_size=(1.0 - frac_train), random_state=random_state
)
# Split the temp dataframe into val and test dataframes.
relative_frac_test = frac_test / (frac_val + frac_test)
df_val, df_test, y_val, y_test = train_test_split(
df_temp,
y_temp,
stratify=y_temp,
test_size=relative_frac_test,
random_state=random_state,
)
assert len(df_input) == len(df_train) + len(df_val) + len(df_test)
return df_train, df_val, df_test
In [7]:
# Вывод распределения количества наблюдений по меткам (классам)
print(df.Pclass.value_counts())

data = df[["Pclass", "Survived", "AgeFillMedian"]].copy()

df_train, df_val, df_test = split_stratified_into_train_val_test(
   data, stratify_colname="Pclass", frac_train=0.60, frac_val=0.20, frac_test=0.20
)

print("Обучающая выборка: ", df_train.shape)
print(df_train.Pclass.value_counts())

print("Контрольная выборка: ", df_val.shape)
print(df_val.Pclass.value_counts())

print("Тестовая выборка: ", df_test.shape)
print(df_test.Pclass.value_counts())
Выборка с избытком (oversampling)
https://www.blog.trainindata.com/oversampling-techniques-for-imbalanced-data/
https://datacrayon.com/machine-learning/class-imbalance-and-oversampling/
Выборка с недостатком (undersampling)
Библиотека imbalanced-learn
In [8]:
from imblearn.over_sampling import ADASYN

ada = ADASYN()

print("Обучающая выборка: ", df_train.shape)
print(df_train.Pclass.value_counts())

X_resampled, y_resampled = ada.fit_resample(df_train, df_train["Pclass"])
df_train_adasyn = pd.DataFrame(X_resampled)

print("Обучающая выборка после oversampling: ", df_train_adasyn.shape)
print(df_train_adasyn.Pclass.value_counts())

df_train_adasyn
Out[8]: